<!DOCTYPE html>
<html lang="en">
<head>
<meta charset="UTF-8">
<meta name="viewport" content="width=device-width, initial-scale=1.0">
<title>深圳高峰期路口延误指数评级</title>
<style>
html,
body,
#map {
width: 100%;
height: 100%;
margin: 0;
padding: 0;
}
.demo-title {
position: absolute;
top: 25px;
left: 25px;
z-index: 1;
}
h1 {
font-size: 18px;
margin: 0;
color: rgb(180, 180, 190);
}
h3 {
font-size: 12px;
font-weight: normal;
margin-top: 5px;
color: rgb(150,150,150);
}
</style>
</head>
<body>
<div class="demo-title">
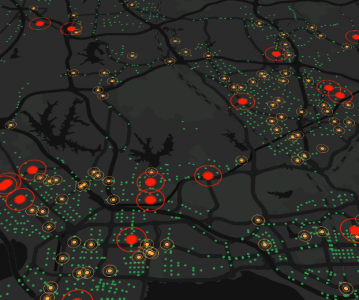
<h1>呼吸点—深圳高峰期路口延误指数评级</h1>
<h3>每个路口的延误指数,其中EF等级是拥堵较严重路口</h3>
</div>
<div id="map"></div>
<script src="https://webapi.amap.com/maps?v=2.0&key=您申请的key值"></script>
<script src="https://webapi.amap.com/loca?v=2.0.0&key=您申请的key值"></script>
<script>
var map = window.map = new AMap.Map('map', {
zoom: 11.7,
center: [113.97199630737305, 22.5807295363949],
pitch: 40,
showLabel: false,
mapStyle: 'amap://styles/45311ae996a8bea0da10ad5151f72979',
viewMode: '3D',
});
var loca = window.loca = new Loca.Container({
map,
});
// 蓝色普通点
var geo = new Loca.GeoJSONSource({
url: 'https://a.amap.com/Loca/static/loca-v2/demos/mock_data/sz_road.json',
});
var scatter = new Loca.ScatterLayer({
zIndex: 111,
opacity: 1,
visible: true,
zooms: [2, 22],
});
scatter.setSource(geo);
scatter.setStyle({
color: 'rgba(43,156,75,1)',
unit: 'meter',
size: [150, 150],
borderWidth: 0,
});
loca.add(scatter);
// 红色呼吸点
var geoLevelF = new Loca.GeoJSONSource({
// data: [],
url: 'https://a.amap.com/Loca/static/loca-v2/demos/mock_data/sz_road_F.json',
});
var breathRed = new Loca.ScatterLayer({
loca,
zIndex: 113,
opacity: 1,
visible: true,
zooms: [2, 22],
});
breathRed.setSource(geoLevelF);
breathRed.setStyle({
unit: 'meter',
size: [2600, 2600],
borderWidth: 0,
texture: 'https://a.amap.com/Loca/static/loca-v2/demos/images/breath_red.png',
duration: 500,
animate: true,
});
// 黄色呼吸点
var geoLevelE = new Loca.GeoJSONSource({
// data: [],
url: 'https://a.amap.com/Loca/static/loca-v2/demos/mock_data/sz_road_E.json',
});
var breathYellow = new Loca.ScatterLayer({
loca,
zIndex: 112,
opacity: 1,
visible: true,
zooms: [2, 22],
});
breathYellow.setSource(geoLevelE);
breathYellow.setStyle({
unit: 'meter',
size: [1000, 1000],
borderWidth: 0,
texture: 'https://a.amap.com/Loca/static/loca-v2/demos/images/breath_yellow.png',
duration: 1000,
animate: true,
});
// 启动渲染动画
loca.animate.start();
var dat = new Loca.Dat();
dat.addLayer(scatter, ' 贴地');
dat.addLayer(breathRed, '红色');
dat.addLayer(breathYellow, '黄色');
</script>
</body>
</html>