<!doctype html>
<html>
<head>
<meta charset="utf-8">
<meta http-equiv="X-UA-Compatible" content="IE=edge">
<meta name="viewport" content="initial-scale=1.0, user-scalable=no, width=device-width">
<style>
html,
body,
#container {
width: 100%;
height: 100%;
}
</style>
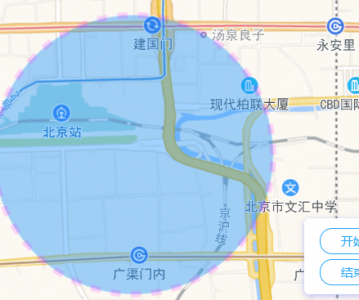
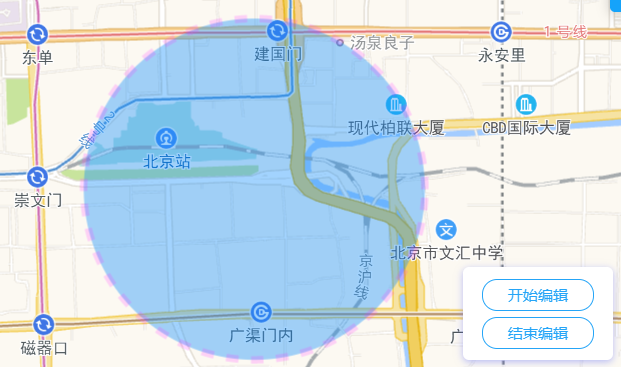
<title>圆的绘制和编辑</title>
<link rel="stylesheet" href="https://a.amap.com/jsapi_demos/static/demo-center/css/demo-center.css" />
<script src="https://webapi.amap.com/maps?v=1.4.15&key=您申请的key值&plugin=AMap.CircleEditor"></script>
<script src="https://a.amap.com/jsapi_demos/static/demo-center/js/demoutils.js"></script>
</head>
<body>
<div id="container"></div>
<div class="input-card" style="width: 120px">
<button class="btn" onclick="circleEditor.open()" style="margin-bottom: 5px">开始编辑</button>
<button class="btn" onclick="circleEditor.close()">结束编辑</button>
</div>
<script type="text/javascript">
var map = new AMap.Map("container", {
center: [116.433322, 39.900256],
zoom: 14
});
var circle = new AMap.Circle({
center: [116.433322, 39.900255],
radius: 1000, //半径
borderWeight: 3,
strokeColor: "#FF33FF",
strokeOpacity: 1,
strokeWeight: 6,
strokeOpacity: 0.2,
fillOpacity: 0.4,
strokeStyle: 'dashed',
strokeDasharray: [10, 10],
// 线样式还支持 'dashed'
fillColor: '#1791fc',
zIndex: 50,
})
circle.setMap(map)
// 缩放地图到合适的视野级别
map.setFitView([ circle ])
var circleEditor = new AMap.CircleEditor(map, circle)
circleEditor.on('move', function(event) {
log.info('触发事件:move')
})
circleEditor.on('adjust', function(event) {
log.info('触发事件:adjust')
})
circleEditor.on('end', function(event) {
log.info('触发事件: end')
// event.target 即为编辑后的圆形对象
})
</script>
</body>
</html>