<!doctype html>
<html>
<head>
<meta charset="utf-8">
<meta http-equiv="X-UA-Compatible" content="IE=edge">
<meta name="viewport" content="initial-scale=1.0, user-scalable=no, width=device-width">
<title>热力图</title>
<link rel="stylesheet" href="https://a.amap.com/jsapi_demos/static/demo-center/css/demo-center.css"/>
<style>
html,
body,
#container {
margin: 0;
padding: 0;
width: 100%;
height: 100%;
}
</style>
</head>
<body>
<div id="container"></div>
<div class="input-card" style="width: auto;">
<div class="input-item">
<button class="btn" onclick="heatmap.show()">显示热力图</button>
</div>
<div class="input-item">
<button class="btn" onclick="heatmap.hide()">关闭热力图</button>
</div>
</div>
<script src="//webapi.amap.com/maps?v=1.4.15&key=您申请的key值"></script>
<script src="//a.amap.com/jsapi_demos/static/resource/heatmapData.js"></script>
<script>
var map = new AMap.Map("container", {
resizeEnable: true,
center: [116.418261, 39.921984],
zoom: 11
});
if (!isSupportCanvas()) {
alert('热力图仅对支持canvas的浏览器适用,您所使用的浏览器不能使用热力图功能,请换个浏览器试试~')
}
//详细的参数,可以查看heatmap.js的文档 http://www.patrick-wied.at/static/heatmapjs/docs.html
//参数说明如下:
/* visible 热力图是否显示,默认为true
* opacity 热力图的透明度,分别对应heatmap.js的minOpacity和maxOpacity
* radius 势力图的每个点的半径大小
* gradient {JSON} 热力图的渐变区间 . gradient如下所示
* {
.2:'rgb(0, 255, 255)',
.5:'rgb(0, 110, 255)',
.8:'rgb(100, 0, 255)'
}
其中 key 表示插值的位置, 0-1
value 为颜色值
*/
var heatmap;
map.plugin(["AMap.Heatmap"], function () {
//初始化heatmap对象
heatmap = new AMap.Heatmap(map, {
radius: 25, //给定半径
opacity: [0, 0.8]
/*,
gradient:{
0.5: 'blue',
0.65: 'rgb(117,211,248)',
0.7: 'rgb(0, 255, 0)',
0.9: '#ffea00',
1.0: 'red'
}
*/
});
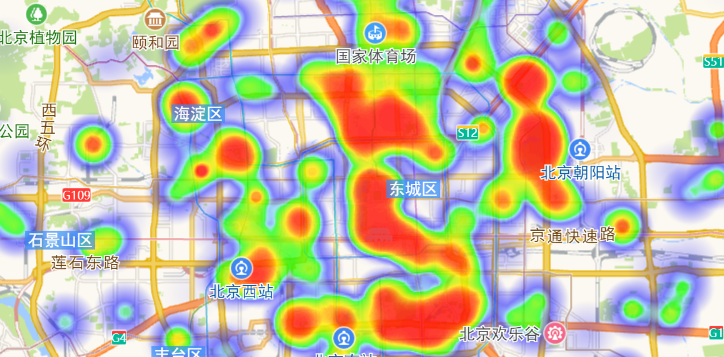
//设置数据集:该数据为北京部分“公园”数据
heatmap.setDataSet({
data: heatmapData,
max: 100
});
});
//判断浏览区是否支持canvas
function isSupportCanvas() {
var elem = document.createElement('canvas');
return !!(elem.getContext && elem.getContext('2d'));
}
</script>
</body>
</html>
