<!doctype html>
<html>
<head>
<meta charset="utf-8">
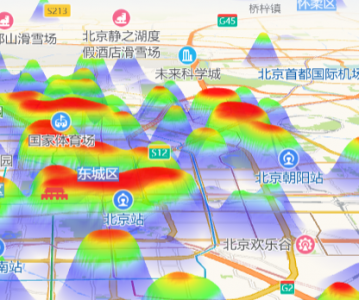
<title>3D热力图</title>
<link rel="stylesheet" type="text/css" href="https://a.amap.com/jsapi_demos/static/bezier/bezier.css">
<style>
html,
body,
#container {
width: 100%;
height: 100%;
margin: 0px;
font-size: 13px;
}
</style>
</head>
<body>
<div id="container"></div>
<div class="graph">
<h2>heightBezier:</h2>
<input type="text" id="bezierInp" readonly="readonly"/>
<figure>
<canvas id="curve" width="210" height="550"></canvas>
<figcaption id="axisHeat">热度</figcaption>
<figcaption id="axisHeight">高度</figcaption>
</figure>
</div>
<script type="text/javascript" src="https://a.amap.com/jsapi_demos/static/resource/heatmapData.js"></script>
<script src="https://webapi.amap.com/maps?v=1.4.15&key=您申请的key值&plugin=AMap.CustomLayer,AMap.ControlBar,AMap.Heatmap"></script>
<script src="https://a.amap.com/jsapi_demos/static/bezier/bezier.js"></script>
<script type="text/javascript">
var map = new AMap.Map("container", {
viewMode: '3D',
pitch: 70,
resizeEnable: true,
center: [116.418261, 39.921984],
zoom: 11.5
});
map.addControl(new AMap.ControlBar({}));
var heatmapOpts = {
//3d 相关的参数
'3d': {
//热度转高度的曲线控制参数,可以利用左侧的控制面板获取
heightBezier: [0.4, 0.2, 0.4, 0.8],
//取样精度,值越小,曲面效果越精细,但同时性能消耗越大
gridSize: 2,
heightScale: 1
}
};
//初始化heatmap对象
var heatmap = new AMap.Heatmap(map, heatmapOpts);
heatmap.setDataSet({
data: heatmapData,
max: 100
});
//控制左侧的曲线控制面板
(function () {
var bezierInp = document.getElementById('bezierInp');
function onBezierUpdate(val) {
bezierInp.value = (val);
heatmapOpts['3d'].heightBezier = val;
if (heatmap) {
heatmap.setOptions(heatmapOpts);
}
}
bezierHelper.setBezier(heatmapOpts['3d'].heightBezier);
bezierInp.value = (bezierHelper.getBezier());
window.onBezierUpdate = onBezierUpdate;
})();
</script>
</body>
</html>