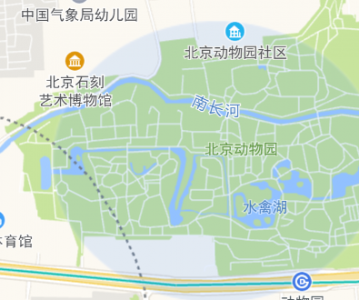
<!DOCTYPE html>
<html lang="en">
<head>
    <meta charset="utf-8">
    <meta http-equiv="X-UA-Compatible" content="IE=edge">
    <title>ImageLayer</title>
    <meta id="viewport" name="viewport" content="width=device-width,user-scalable=no,initial-scale=1.0,maximum-scale=1.0"/>
    <style>
        html,
        body,
        #container {
            margin: 0;
            padding: 0;
            width: 100%;
            height: 100%;
        }
    </style>
</head>
<body>
<div id="container"></div>
<script src="https://webapi.amap.com/maps?v=1.4.15&key=您申请的key值"></script>
<script>
    var map = new AMap.Map('container', {
        resizeEnable: true,
        // viewMode:"3D",
        zoom: 15,
        center: [116.335183, 39.941735]
    });

    AMap.plugin(["AMap.ControlBar"], function () {
        var bar = new AMap.ControlBar();
        map.addControl(bar);
    });

    /*
     * 添加Canvas图层
     */
    var canvas = document.createElement('canvas');
    canvas.width = canvas.height = 200;

    var context = canvas.getContext('2d')
    context.fillStyle = 'rgb(0,100,255)';
    context.strokeStyle = 'white';
    context.globalAlpha = 1;
    context.lineWidth = 2;

    var radious = 0;
    var draw = function () {
        context.clearRect(0, 0, 200, 200)
        context.globalAlpha = (context.globalAlpha - 0.01 + 1) % 1;
        radious = (radious + 1) % 100;

        context.beginPath();
        context.arc(100, 100, radious, 0, 2 * Math.PI);
        context.fill();
        context.stroke();

        //2D视图时可以省略
        CanvasLayer.reFresh();

        AMap.Util.requestAnimFrame(draw);
    };

    var CanvasLayer = new AMap.CanvasLayer({
        canvas: canvas,
        bounds: new AMap.Bounds(
            [116.328911, 39.937229],
            [116.342659, 39.946275]
        ),
        zooms: [3, 18],
    });

    CanvasLayer.setMap(map);
    draw();

</script>
</body>
</html>

