<!doctype html>
<html>
<head>
<meta charset="utf-8">
<meta http-equiv="X-UA-Compatible" content="IE=edge">
<meta name="viewport" content="initial-scale=1.0, user-scalable=no, width=device-width">
<title>绘制大地线</title>
<style>
html,
body,
#container {
width: 100%;
height: 100%;
}
</style>
<script src="https://webapi.amap.com/maps?v=1.4.15&key=您申请的key值"></script>
<script type="text/javascript" src="https://cache.amap.com/lbs/static/addToolbar.js"></script>
</head>
<body>
<div id="container"></div>
<script>
var map = new AMap.Map('container', {
resizeEnable: true,
center: [116.397428, 39.90923],
zoom: 3
});
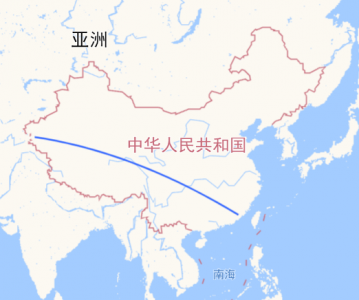
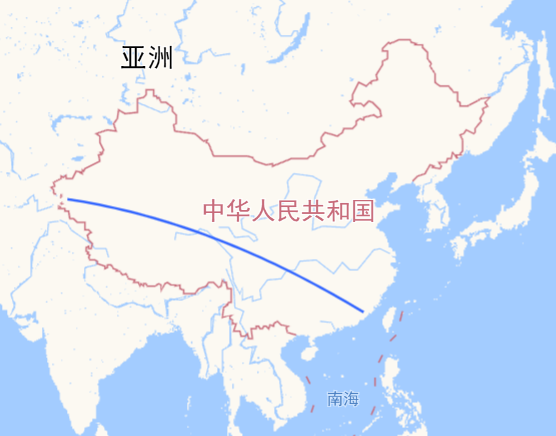
var lineArr = [
['75.757904', '38.118117'],
['117.375719', '24.598057']
];
var polyline = new AMap.Polyline({
path: lineArr, // 设置线覆盖物路径
strokeColor: '#3366FF', // 线颜色
strokeOpacity: 1, // 线透明度
strokeWeight: 2, // 线宽
strokeStyle: 'solid', // 线样式
strokeDasharray: [10, 5], // 补充线样式
geodesic: true // 绘制大地线
});
polyline.setMap(map);
</script>
</body>
</html>