<!DOCTYPE html>
<html lang="en">
<head>
<meta charset="UTF-8">
<meta name="viewport" content="width=device-width, initial-scale=1.0">
<title>大小点—中国城市人口数量及GDP排行</title>
<style>
html,
body,
#map {
width: 100%;
height: 100%;
margin: 0;
padding: 0;
}
.demo-title {
position: absolute;
top: 25px;
left: 25px;
z-index: 1;
}
h1 {
font-size: 18px;
margin: 0;
color: rgb(180, 180, 190);
}
h3 {
font-size: 12px;
font-weight: normal;
margin-top: 5px;
color: rgb(150,150,150);
}
</style>
</head>
<body>
<div class="demo-title">
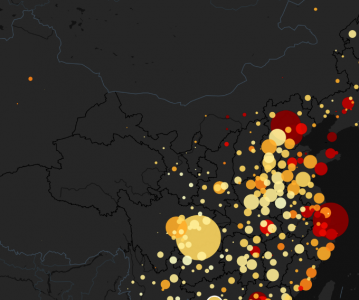
<h1>大小点—中国城市人口数量及GDP排行</h1>
<h3>中国城市各人口数量,总GDP数量和人均GDP排行情况</h3>
</div>
<div id="map"></div>
<script src="https://webapi.amap.com/maps?v=2.0&key=您申请的key值&plugin=AMap.Scale,AMap.ToolBar"></script>
<script src="https://webapi.amap.com/loca?v=2.0.0&key=您申请的key值"></script>
<script>
var map = new AMap.Map('map', {
zoom: 4.8,
showLabel: false,
viewMode: '3D',
center: [105.601, 35.32],
mapStyle: 'amap://styles/45311ae996a8bea0da10ad5151f72979',
});
var tool = new AMap.ToolBar();
tool.addTo(map);
var loca = new Loca.Container({
map,
});
var pl = window.pl = new Loca.PointLayer({
zIndex: 10,
opacity: 1,
blend: 'normal',
});
var geo = new Loca.GeoJSONSource({
url: 'https://a.amap.com/Loca/static/loca-v2/demos/mock_data/gdp.json',
});
pl.setSource(geo);
var colors = [
'rgba(254,255,198,0.95)',
'rgba(255,238,149,0.95)',
'rgba(255,217,99,0.95)',
'rgba(255,175,43,0.95)',
'rgba(255,135,24,0.95)',
'rgba(234,10,0,0.95)',
'rgba(195,0,0,0.95)',
'rgba(139,0,0,0.95)',
];
var style = {
unit: 'meter',
radius: (index, f) => {
var n = f.properties['人口'];
return n * 100;
},
color: (index, f) => {
var n = Math.min(7, ~~(f.properties['人均GDP'] / 10000));
return colors[n];
},
borderWidth: 0,
blurRadius: -1,
}
pl.setStyle(style)
loca.add(pl);
// 图例
var lengend = new Loca.Legend({
loca: loca,
title: {
label: '人均GDP',
fontColor: 'rgba(255,255,255,0.4)',
fontSize: '16px',
},
style: {
backgroundColor: 'rgba(255,255,255,0.1)',
left: '20px',
bottom: '40px',
fontSize: '12px',
},
dataMap: [
{ label: '> 8万', color: colors[7] },
{ label: '< 7万', color: colors[6] },
{ label: '< 6万', color: colors[5] },
{ label: '< 5万', color: colors[4] },
{ label: '< 4万', color: colors[3] },
{ label: '< 3万', color: colors[2] },
{ label: '< 2万', color: colors[1] },
{ label: '< 1万', color: colors[0] },
],
});
var dat = new Loca.Dat();
dat.addLayer(pl, 'GDP');
// 动画
map.on('complete', function () {
pl.addAnimate({
key: 'radius',
value: [0, 1],
duration: 2000,
easing: 'ElasticOut',
// yoyo: false,
// repeat: 1,
});
pl.show(600);
});
map.on('mousemove', (e) => {
const feat = pl.queryFeature(e.pixel.toArray());
if (feat) {
pl.setStyle({
unit: 'meter',
radius: (index, f) => {
var n = f.properties['人口'] * 100;
if (f === feat) {
return n + 30000;
}
return n;
},
color: (index, f) => {
var n = Math.min(7, ~~(f.properties['人均GDP'] / 10000));
return colors[n];
},
borderWidth: (index, f) => {
return f === feat ? 20000 : 0;
},
blurWidth: -1,
});
}
});
</script>
</body>
</html>