<!DOCTYPE html>
<html lang="en">
<head>
<meta charset="UTF-8" />
<meta name="viewport" content="width=device-width, initial-scale=1.0" />
<title>中国各年代的建交国家</title>
<style>
html,
body,
#map {
width: 100%;
height: 100%;
margin: 0;
padding: 0;
}
body {
font-weight: 500;
color: #fff;
background-color: #000;
position: relative;
}
.demo-title {
position: absolute;
top: 25px;
left: 25px;
z-index: 1;
}
h1 {
font-size: 18px;
margin: 0;
color: rgb(180, 180, 190);
}
h3 {
font-size: 12px;
font-weight: normal;
margin-top: 5px;
color: rgb(150,150,150);
}
.time-container {
display: flex;
justify-content: space-around;
align-items: center;
width: 80vw;
height: 100px;
max-width: 800px;
position: absolute;
z-index: 0;
bottom: 30px;
left: 50%;
transform: translateX(-50%);
background-color: rgba(38, 38, 38, 0.4);
}
.item {
width: 20px;
height: 20px;
background-color: #12bfbf;
position: relative;
border-radius: 50%;
}
.item:hover {
cursor: pointer;
}
.item::before,
.item::after {
content: '';
display: block;
position: absolute;
z-index: -1;
top: 50%;
transform: translateY(-50%);
background-color: #12bfbf;
width: 13.3333333333vw;
height: 2px;
max-width: 133.3333333333px;
}
.item::before {
left: calc(-13.3333333333vw + 10px);
}
.item::after {
right: calc(-13.3333333333vw + 10px);
}
.item:first-child::before {
width: 0;
}
.item:last-child::after {
width: 0;
}
.item.active {
background-color: #12bfbf;
}
.item.active span {
background-color: #12bfbf;
font-weight: 700;
}
.item.active span::before {
font-size: 15px;
}
.item.active span::after {
font-size: 15px;
}
.item span {
width: 14px;
height: 14px;
background-color: #262626;
border-radius: 50%;
position: absolute;
top: 50%;
left: 50%;
transform: translate(-50%, -50%);
}
.item span::after {
visibility: visible;
position: absolute;
left: 50%;
content: attr(data-info);
top: 25px;
transform: translateX(-50%);
font-size: 14px;
width: 70px;
text-align: center;
}
@media (min-width: 1000px) {
.item::before {
left: -123.3333333333px;
}
.item::after {
right: -123.3333333333px;
}
}
@media (max-width: 850px) {
.item {
width: 10px;
height: 10px;
}
.item::before,
.item::after {
height: 3px;
}
.item::before {
left: calc(-13.3333333333vw + 5px);
}
.item::after {
right: calc(-13.3333333333vw + 5px);
}
}
@media (max-width: 600px) {
.flex-parent {
justify-content: initial;
}
.time-container {
flex-wrap: wrap;
justify-content: center;
width: 100%;
height: auto;
margin-top: 15vh;
}
.item {
width: 60px;
height: 60px;
margin: 0 10px 50px;
}
.item::before,
.item::after {
content: none;
}
.item span {
width: 100%;
height: 100%;
display: block;
}
.item span::after {
top: 50%;
transform: translate(-50%, -50%);
color: #12bfbf;
}
.item.active span::after {
color: #fff;
}
}
</style>
</head>
<body>
<div id="map"></div>
<div class="demo-title">
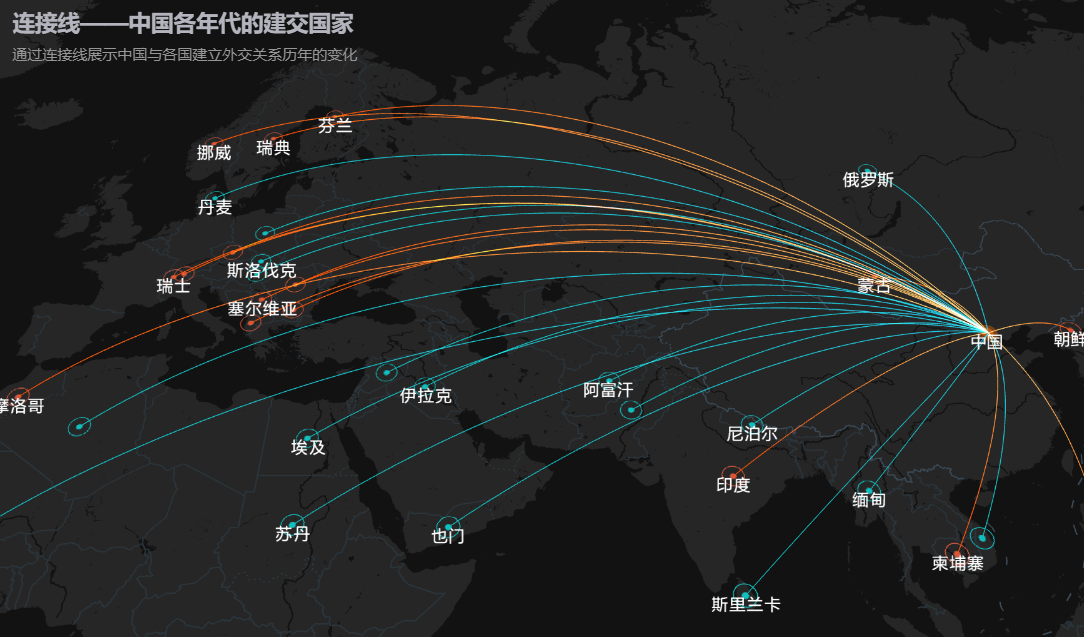
<h1>连接线——中国各年代的建交国家</h1>
<h3>通过连接线展示中国与各国建立外交关系历年的变化</h3>
</div>
<div class="time-container">
<div class="item active">
<span data-year="50" data-info="50年代"></span>
</div>
<div class="item">
<span data-year="60" data-info="60年代"></span>
</div>
<div class="item">
<span data-year="70" data-info="70年代"></span>
</div>
<div class="item">
<span data-year="80" data-info="80年代"></span>
</div>
<div class="item">
<span data-year="90" data-info="90年代"></span>
</div>
<div class="item">
<span data-year="2000" data-info="2000年后"></span>
</div>
</div>
<script src="https://webapi.amap.com/maps?v=2.0&key=您申请的key值"></script>
<script src="https://webapi.amap.com/loca?v=2.0.0&key=您申请的key值"></script>
<script>
var map = new AMap.Map('map', {
zoom: 3.2,
pitch: 32,
showLabel: false,
viewMode: '3D',
center: [59.890102,29.256014],
mapStyle: 'amap://styles/45311ae996a8bea0da10ad5151f72979',
});
// 文字图层
var labelLayer = new AMap.LabelsLayer({
rejectMapMask: true,
collision: true,
animation: true,
});
map.add(labelLayer);
var loca = new Loca.Container({
map,
});
var linkLayer = new Loca.LinkLayer({
zIndex: 20,
opacity: 1,
visible: true,
zooms: [2, 22],
});
var scatterLayer1 = new Loca.ScatterLayer({
zIndex: 10,
opacity: 1,
visible: true,
zooms: [2, 22],
});
var scatterLayer2 = new Loca.ScatterLayer({
zIndex: 10,
opacity: 0.8,
visible: true,
zooms: [2, 22],
});
var scatterLayer3 = new Loca.ScatterLayer({
zIndex: 10,
opacity: 0.8,
visible: true,
zooms: [2, 22],
});
var centerPoint = new Loca.GeoJSONSource({
data: {
'type': 'FeatureCollection',
'features': [
{
'type': 'Feature',
'geometry': {
'type': 'Point',
'coordinates': [116.39, 39.9],
},
},
],
},
});
scatterLayer3.setSource(centerPoint);
scatterLayer3.setStyle({
size: [300000, 300000],
unit: 'meter',
texture: 'https://a.amap.com/Loca/static/static/center-point.png',
});
loca.add(scatterLayer3);
var lineGeoMap;
var scatterGeoMap;
var filterGeoJSON = (json, type) => {
var newJSON = {
type: 'FeatureCollection',
features: [...json.features.filter((item) => item.properties.type === type)],
};
return new Loca.GeoJSONSource({
data: newJSON,
});
};
var setLabelsLayer = (data) => {
labelLayer.clear();
data.features.forEach((item) => {
var labelsMarker = new AMap.LabelMarker({
name: item.properties.flagName,
position: item.geometry.coordinates,
zooms: [2, 22],
opacity: 1,
zIndex: 10,
text: {
content: item.properties.country,
direction: 'bottom',
offset: [0, -5],
style: {
fontSize: 13,
fontWeight: 'normal',
fillColor: '#fff',
},
},
});
labelLayer.add(labelsMarker);
});
labelLayer.add(
new AMap.LabelMarker({
name: 'china',
position: [116.39, 39.9],
zooms: [2, 22],
opacity: 1,
zIndex: 10,
rank: 100,
text: {
content: '中国',
direction: 'bottom',
offset: [0, -5],
style: {
fontSize: 13,
fontWeight: 'normal',
fillColor: '#fff',
},
},
}),
);
};
fetch('https://a.amap.com/Loca/static/static/diplomacy-point.json')
.then((res) => res.json())
.then((data) => {
scatterGeoMap = data;
setLabelsLayer(scatterGeoMap[50]);
var source1 = filterGeoJSON(scatterGeoMap[50], 0);
var source2 = filterGeoJSON(scatterGeoMap[50], 1);
scatterLayer1.setSource(source1);
scatterLayer2.setSource(source2);
scatterLayer1.setStyle({
size: [500000, 500000],
unit: 'miter',
animate: true,
duration: 1000,
texture: 'https://a.amap.com/Loca/static/static/green.png',
});
scatterLayer2.setStyle({
size: [500000, 500000],
unit: 'miter',
animate: true,
duration: 1000,
texture: 'https://a.amap.com/Loca/static/static/orange.png',
});
loca.add(scatterLayer1);
loca.add(scatterLayer2);
loca.animate.start();
});
fetch('https://a.amap.com/Loca/static/static/diplomacy-line.json')
.then((res) => res.json())
.then((data) => {
lineGeoMap = Object.entries(data).reduce((accu, curr) => {
var [key, geo] = curr;
accu[key] = new Loca.GeoJSONSource({
data: geo,
});
return accu;
}, {});
linkLayer.setSource(lineGeoMap[50]);
linkLayer.setStyle({
lineColors: function (index, item) {
return item.link.properties.type === 0 ? ['#25CDEA', '#12BFBF'] : ['#FFD87B', '#FF4F00'];
},
height: function (index, item) {
return item.distance / 3;
},
smoothSteps: function (index, item) {
return 200;
},
});
loca.add(linkLayer);
});
var items = document.querySelectorAll('.item');
for (var i = 0; i < items.length; i++) {
(function (j) {
items[j].onclick = () => {
var element = items[j];
var key = element.children[0].dataset.year;
document.querySelector('div.item.active').classList.remove('active');
element.classList.add('active');
linkLayer.setSource(lineGeoMap[key]);
setLabelsLayer(scatterGeoMap[key]);
scatterLayer1.setSource(filterGeoJSON(scatterGeoMap[key], 0));
scatterLayer2.setSource(filterGeoJSON(scatterGeoMap[key], 1));
};
})(i);
}
</script>
</body>
</html>