<!DOCTYPE html>
<html lang="en">
<head>
<meta charset="UTF-8">
<meta name="viewport" content="width=device-width, initial-scale=1.0">
<title>青岛分布热力图</title>
<style>
html,
body,
#map {
width: 100%;
height: 100%;
margin: 0;
padding: 0;
}
.demo-title {
position: absolute;
top: 50px;
left: 50px;
z-index: 1;
}
h1 {
margin: 0;
color: #abb3bb;
}
h3 {
font-weight: normal;
margin-top: 5px;
color: #aaa;
}
</style>
</head>
<body>
<div class="demo-title">
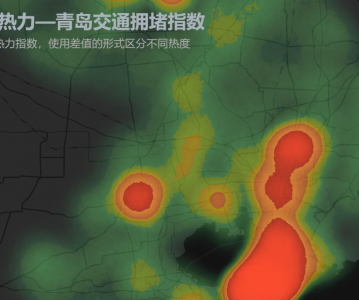
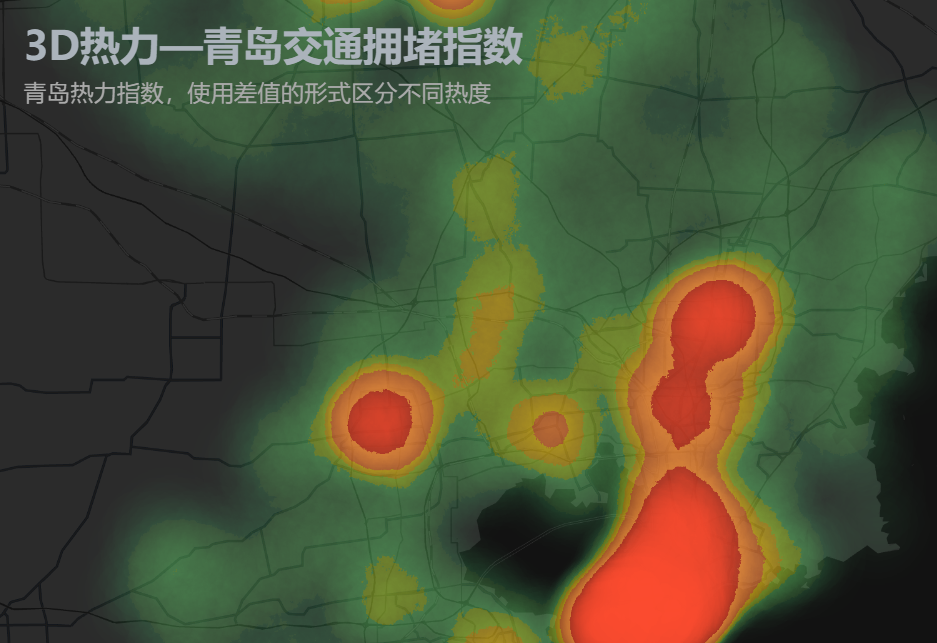
<h1>3D热力—青岛交通拥堵指数</h1>
<h3>青岛热力指数,使用差值的形式区分不同热度</h3>
</div>
<div id="map"></div>
<script
src="https://webapi.amap.com/maps?v=2.0&key=您申请的key值&plugin=AMap.Scale,AMap.ToolBar"></script>
<script src="https://webapi.amap.com/loca?v=2.0.0&key=您申请的key值"></script>
<script>
var map = new AMap.Map('map', {
zoom: 9.66,
center: [120.209524,36.305702],
showLabel: false,
mapStyle: 'amap://styles/45311ae996a8bea0da10ad5151f72979',
viewMode: '3D',
});
var loca = new Loca.Container({
map,
});
var geo = new Loca.GeoJSONSource({
url: 'https://a.amap.com/Loca/static/loca-v2/demos/mock_data/tsing.json',
});
var heatmap = new Loca.HeatMapLayer({
// loca,
zIndex: 10,
opacity: 1,
visible: true,
zooms: [2, 22],
});
heatmap.setSource(geo, {
radius: 9000,
unit: 'meter',
height: 8000,
difference: true,
gradient: {
1: '#FF4C2F',
0.8: '#FAA53F',
0.6: '#FFF100',
0.5: '#7DF675',
0.4: '#5CE182',
0.2: '#29CF6F',
},
value: function (index, feature) {
return feature.properties.count;
},
opacity: [0, 1],
heightBezier: [0, 0.53, 0.37, 0.98]
});
loca.add(heatmap);
map.on('click', () => {
heatmap.addAnimate({
key: 'radius',
value: [0, 1],
random: true,
transform: 1000,
delay: 6000,
easing: 'BounceOut' //https://redmed.github.io/chito/example/easing.html
});
});
</script>
</body>
</html>