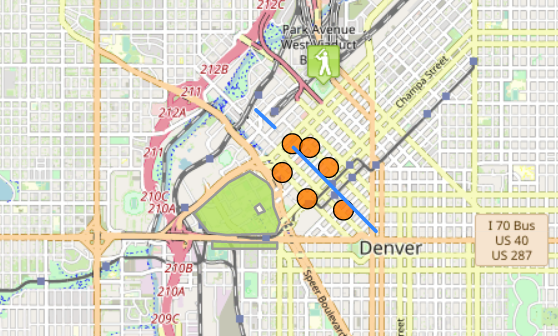

GeoJSON 是许多 GIS 技术和服务中非常流行的数据格式——它简单、轻量、直接,并且 Leaflet 非常擅长处理它。在此示例中,您将学习如何创建从 GeoJSON 对象创建的地图矢量并与之交互。
关于 GeoJSON
根据 GeoJSON 规范 (RFC 7946): GeoJSON 是一种用于编码各种地理数据结构的格式 […]。
GeoJSON 对象可以表示空间区域(几何)、空间有界实体(特征)或特征列表(特征集合)。 GeoJSON 支持以下几何类型:Point、LineString、Polygon、MultiPoint、MultiLineString、MultiPolygon 和 GeometryCollection。
GeoJSON 中的特征包含一个几何对象和附加属性,一个 FeatureCollection 包含一个特征列表。 Leaflet 支持上述所有 GeoJSON 类型,但 Features 和 FeatureCollections 效果最好,因为它们允许您使用一组属性来描述功能。我们甚至可以使用这些属性来设置 Leaflet 向量的样式。下面是一个简单的 GeoJSON 功能示例:
var geojsonFeature = {
    "type": "Feature",
    "properties": {
        "name": "Coors Field",
        "amenity": "Baseball Stadium",
        "popupContent": "This is where the Rockies play!"
    },
    "geometry": {
        "type": "Point",
        "coordinates": [-104.99404, 39.75621]
    }
};
GeoJSON 层
GeoJSON 对象通过 GeoJSON 层添加到地图中。要创建它并将其添加到地图中,我们可以使用以下代码:
L.geoJSON(geojsonFeature).addTo(map);GeoJSON 对象也可以作为有效 GeoJSON 对象的数组传递。
var myLines = [{
    "type": "LineString",
    "coordinates": [[-100, 40], [-105, 45], [-110, 55]]
}, {
    "type": "LineString",
    "coordinates": [[-105, 40], [-110, 45], [-115, 55]]
}];
我们可以创建一个空的 GeoJSON 图层并将其分配给一个变量,以便我们以后可以向其添加更多功能。
var myLayer = L.geoJSON().addTo(map);
myLayer.addData(geojsonFeature);
选项
风格
style 选项可用于以两种不同的方式对特征进行样式设置。首先,我们可以传递一个简单的对象,以相同的方式设置所有路径(折线和多边形)的样式:
var myLines = [{
    "type": "LineString",
    "coordinates": [[-100, 40], [-105, 45], [-110, 55]]
}, {
    "type": "LineString",
    "coordinates": [[-105, 40], [-110, 45], [-115, 55]]
}];

var myStyle = {
    "color": "#ff7800",
    "weight": 5,
    "opacity": 0.65
};

L.geoJSON(myLines, {
    style: myStyle
}).addTo(map);
我们可以传递一个函数,根据它们的属性设置各个特征的样式。在下面的示例中,我们检查“party”属性并相应地设置多边形样式:
var states = [{
    "type": "Feature",
    "properties": {"party": "Republican"},
    "geometry": {
        "type": "Polygon",
        "coordinates": [[
            [-104.05, 48.99],
            [-97.22,  48.98],
            [-96.58,  45.94],
            [-104.03, 45.94],
            [-104.05, 48.99]
        ]]
    }
}, {
    "type": "Feature",
    "properties": {"party": "Democrat"},
    "geometry": {
        "type": "Polygon",
        "coordinates": [[
            [-109.05, 41.00],
            [-102.06, 40.99],
            [-102.03, 36.99],
            [-109.04, 36.99],
            [-109.05, 41.00]
        ]]
    }
}];

L.geoJSON(states, {
    style: function(feature) {
        switch (feature.properties.party) {
            case 'Republican': return {color: "#ff0000"};
            case 'Democrat':   return {color: "#0000ff"};
        }
    }
}).addTo(map);
点对层
点的处理方式与折线和多边形不同。默认情况下,为 GeoJSON 点绘制简单标记。在创建 GeoJSON 层时,我们可以通过在 GeoJSON 选项对象中传递 pointToLayer 函数来改变这一点。这个函数被传递了一个 LatLng 并且应该返回一个 ILayer 的实例,在这种情况下可能是一个 Marker 或 CircleMarker。
在这里,我们使用 pointToLayer 选项来创建 CircleMarker:
var geojsonMarkerOptions = {
    radius: 8,
    fillColor: "#ff7800",
    color: "#000",
    weight: 1,
    opacity: 1,
    fillOpacity: 0.8
};

L.geoJSON(someGeojsonFeature, {
    pointToLayer: function (feature, latlng) {
        return L.circleMarker(latlng, geojsonMarkerOptions);
    }
}).addTo(map);
我们还可以在这个例子中设置样式属性——如果你在 pointToLayer 函数中创建一个像圆这样的矢量图层,Leaflet 就足够聪明,可以将样式应用于 GeoJSON 点。
onEach 特征 onEachFeature 选项是在将每个要素添加到 GeoJSON 图层之前对其调用的函数。使用此选项的一个常见原因是在单击要素时将弹出窗口附加到要素。
function onEachFeature(feature, layer) {
    // does this feature have a property named popupContent?
    if (feature.properties && feature.properties.popupContent) {
        layer.bindPopup(feature.properties.popupContent);
    }
}

var geojsonFeature = {
    "type": "Feature",
    "properties": {
        "name": "Coors Field",
        "amenity": "Baseball Stadium",
        "popupContent": "This is where the Rockies play!"
    },
    "geometry": {
        "type": "Point",
        "coordinates": [-104.99404, 39.75621]
    }
};

L.geoJSON(geojsonFeature, {
    onEachFeature: onEachFeature
}).addTo(map);
筛选
过滤器选项可用于控制 GeoJSON 功能的可见性。为此,我们传递一个函数作为过滤器选项。为 GeoJSON 图层中的每个要素调用此函数,并传递要素和图层。然后,您可以利用功能属性中的值通过返回 true 或 false 来控制可见性。 在下面的示例中,“Busch Field”将不会显示在地图上。
var someFeatures = [{
    "type": "Feature",
    "properties": {
        "name": "Coors Field",
        "show_on_map": true
    },
    "geometry": {
        "type": "Point",
        "coordinates": [-104.99404, 39.75621]
    }
}, {
    "type": "Feature",
    "properties": {
        "name": "Busch Field",
        "show_on_map": false
    },
    "geometry": {
        "type": "Point",
        "coordinates": [-104.98404, 39.74621]
    }
}];

L.geoJSON(someFeatures, {
    filter: function(feature, layer) {
        return feature.properties.show_on_map;
    }
}).addTo(map);
查看示例页面以详细了解 GeoJSON 层的功能。
这篇文章的原始:https://leafletjs.com/examples/geojson/
只是翻译成了中文代码原封不动
说的对,不过中国境内访问困难